Ok, I know, I said I would implement sound, and I swear I started, but I can explain what happened and why I’m still without sound.
For each kind of data (i.e textures, materials, loaders, etc) I had a manager. Each manager was a singleton, and after coding the Sound manager I said “Dude! I have tons of singletons, it’s time to change that!”. And that’s what I’ve been doing. I’ve centralized managers, factories and containers under the Engine’s hood. To ensure there’s only one instance of each manager I’ve tangled a bit managers and engine :). It’s something like this:
An excerpt of IManager’s code
class IManager

{

public:

IManager(int type, Engine* e); //Constructor

virtual int GetType() = 0; //some RTTI

...

};

// Adds the manager to the engine

IManager::IManager(int type, Engine * e)

{

e->AddManager(type,this);

}
An excerpt of Sound Manager’s code
class SoundManager : public IManager

public:

explicit SoundManager(Engine* e); //Constructor...

virtual int GetType() { return MGRT_SOUND;}

};

// Adds the manager to the engine

SoundManager::SoundManager(int type, Engine * e) : IManager(GetType(),e)

{

}
So as you can see, it’s engine (called from IManager::IManager who decides what to do with the manager’s instance). In my case I stored it in an array.
So once I had all managers de-singletonized (?) I thought:”mmm, I’m not sharing data”. Yes believe it or not, I was loading models, animations and textures as many times as they appeared in the data files. So well, just some more coding following the same schema I had used for managers and well, at the end of the night I was sharing data correctly.
And this morning… I’ve woken up thinking “Ok Toni, so you’re sharing data but, do you know how much memory is your application consuming?”. At Insideo, shash had coded a memory checker, and I’ve thought that doing something similar I could know, at runtime and with a per frame granularity, what was the ammount of memory I was using.
I’ve searched on the internet and I’ve found 2 sources one at flipcode (RIP) and another at CodeProject. I have adapted to my needs and at the end of the day I was tracking the memory consumption…
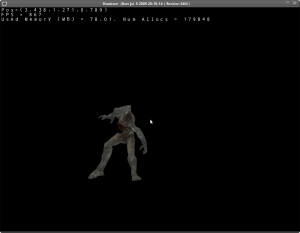
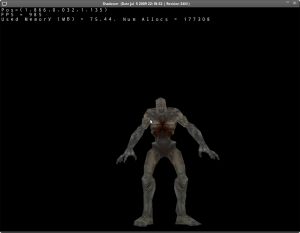
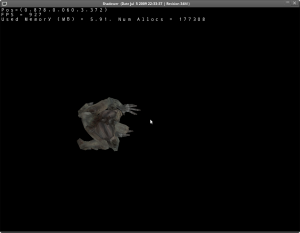
To my surprise my application was a RAM eater monster :| just loading de imp animation and it was taken as much as 78 MB! WTF!!
The first think I’ve thought has been: “textures, probably I don’t release the texture data”. So I’ve checked it, and indeed, I wasn’t releasing it. I fixed it but as I expected I didn’t had a big gain, after all currently I’m only loading 5 textures :).
So… I’ve been thinking… where do I have tons of data and it’s not released? Where? Where? Obviously it was on the loaders, so I just simply added a Reset method to all loaders, call it after loading and that’s it! :)… And you can be wondering :” And where were those dozens of MB?”. Well, the md5 material loader was keeping a table with a translation from material name to material file and some other info. And that table was consuming 70 MB!!
Well, now I have the Ram under control, and I suppose now it’s the momment for sound. The journey of this 2 last days has been interesting, reallocating some classes and studing how to keep track of memory has taught me some good things I didn’t know about memory allocation and new and delete operator overriding :). Probably this will evolve in a near future to some kind of memory allocation manager and custom allocators and all this stuff I’m willing to learn :).
Well, it has been a good weekend, stay tuned!!


